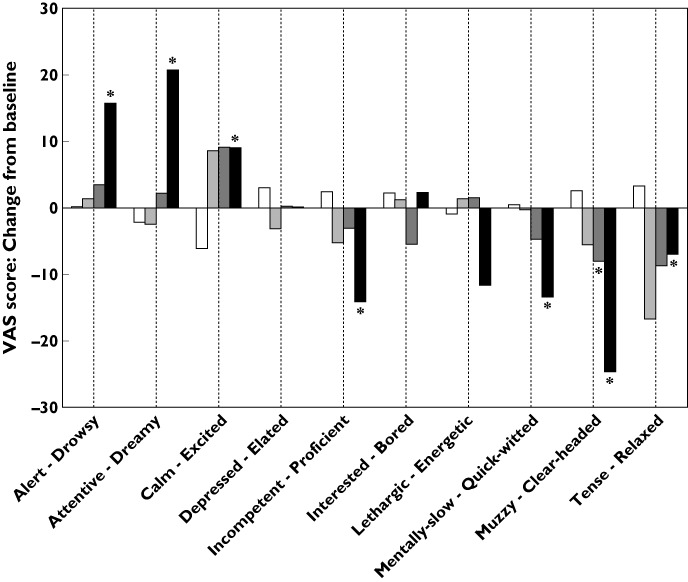
Figure 2.

VAS scores for study 106. The figure shows mean values of difference from baseline scores at 2 h post-dose for the 10 measured VAS. The VAS pairs of adjectives are shown so the first one corresponds to low scores. An asterisk indicates a significant difference vs. placebo in the linear mixed model analysis, adjusted for the baseline value. Baseline values were similar for all groups and in the range of 40 to 70 for all scales, except for ‘calm-excited’, which ranged from 25 to 35. □, Placebo;  , 500 mg;
  , 600 mg,
  , 800 mg
