
Figure 3.
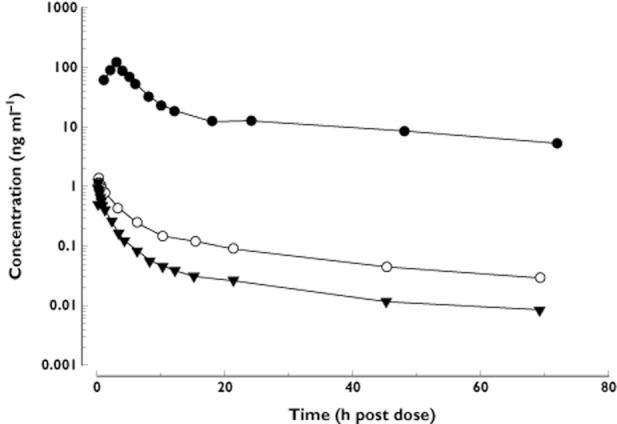
Plasma concentration–time curves for SRT2104 co-administered as an oral dose (0.25 g) and an i.v. microdose (100 μg). (Bioavailability study). •, 0.25 g oral dose; ○, 100 μg i.v. dose – total radioactivity; ▾, 100 μg i.v. dose – SRT2104
Official websites use .gov
A
.gov website belongs to an official
government organization in the United States.
Secure .gov websites use HTTPS
A lock (
) or https:// means you've safely
connected to the .gov website. Share sensitive
information only on official, secure websites.
Plasma concentration–time curves for SRT2104 co-administered as an oral dose (0.25 g) and an i.v. microdose (100 μg). (Bioavailability study). •, 0.25 g oral dose; ○, 100 μg i.v. dose – total radioactivity; ▾, 100 μg i.v. dose – SRT2104