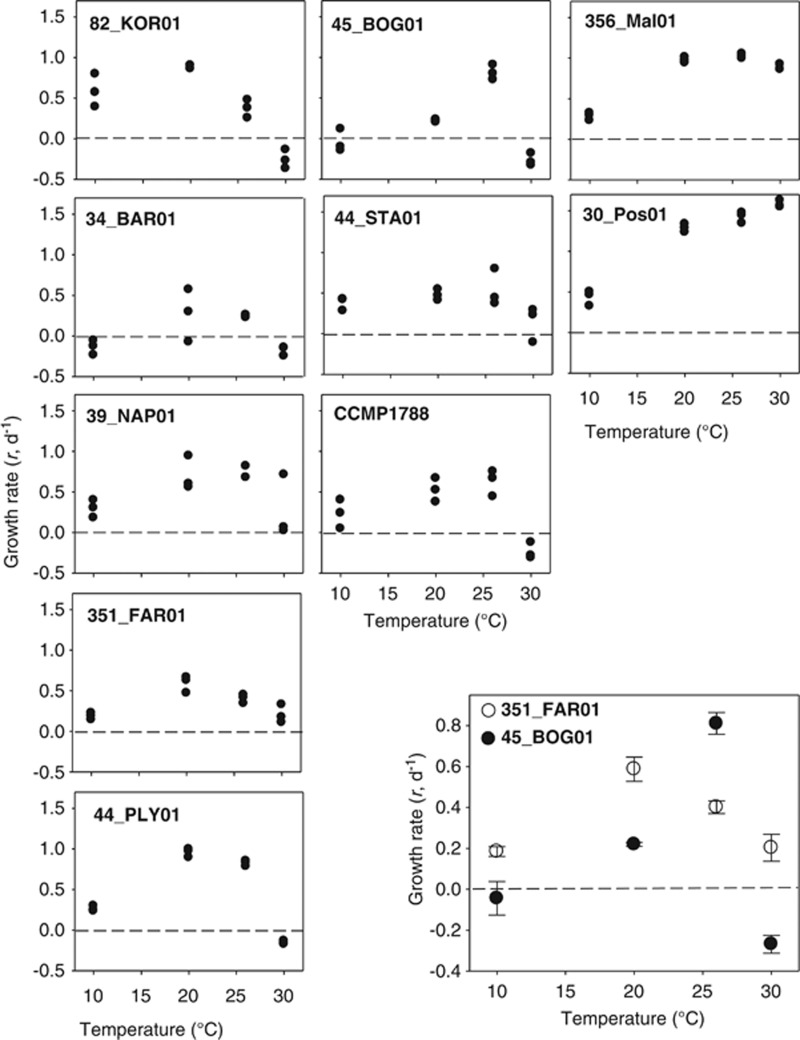
Figure 1.
Thermal responses: specific growth rate responses of 10 Oxyrrhis strains to four temperatures. See Table 1 for information on strains. The dashed horizontal line in each panel shows net zero growth. Three replicate measurements were made at each temperature (indicated by solid dots). The inset at the bottom right is provided as a comparison of two strains (OB, OF) that are used in later sections of this work; in this case mean estimates are presented, with error bars being 1 s.e.

