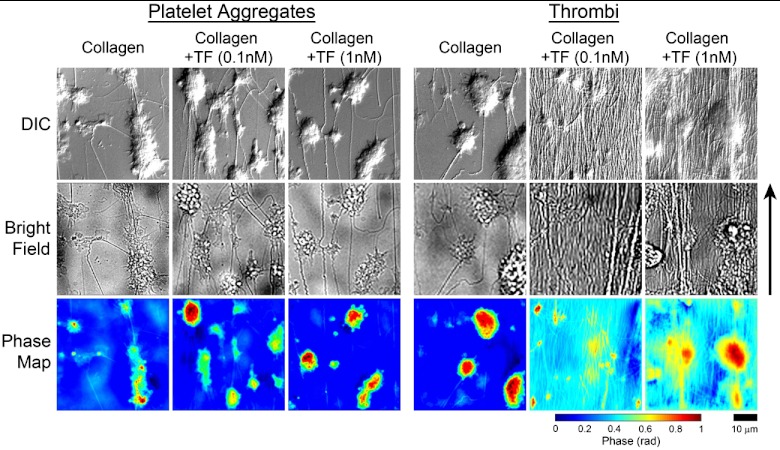
Fig. 1.
Differential interference contrast (top row), brightfield (middle row), and corresponding NI-QPM phase map images (bottom row) for platelet aggregates and thrombi formed on three surfaces: fibrillar collagen, fibrillar collagen TF, and fibrillar collagen TF. The arrow indicates direction of flow. The scale and color bars are common to all images.

