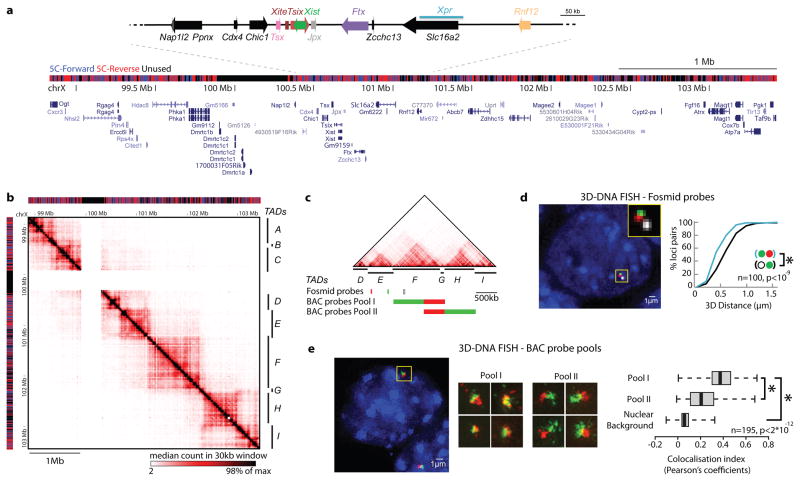
Figure 1. Chromosome partitioning into topologically assocating domains (TADs).
a, Distribution of 5C-Forward and 5C-Reverse HindIII restriction fragments across the 4.5 Mb analysed showing positions of RefSeq Genes and known XCI regulatory loci. b, 5C datasets from XY undifferentiated mESCs (E14), displaying median counts in 30kb windows every 6kb. Chromosomal contacts are organised into discrete genomic blocks (TADs A-F). A region containing segmental duplications excluded from the 5C analysis is masked (white). c, Positions of DNA FISH probes. d, Interphase nuclear distances are smaller for probes in the same 5C domain. e, Structured illumination microscopy reveals that colocalisation of neighbouring sequences is greater when they belong to the same 5C domain. Boxplots display the distribution of Pearson correlation coefficient between red and green channels, with whiskers and boxes encompassing all and 50% of values respectively; central bars denote the median correlation coefficient. Statistical significance was assessed using Wilcoxon’s rank-sum test.

