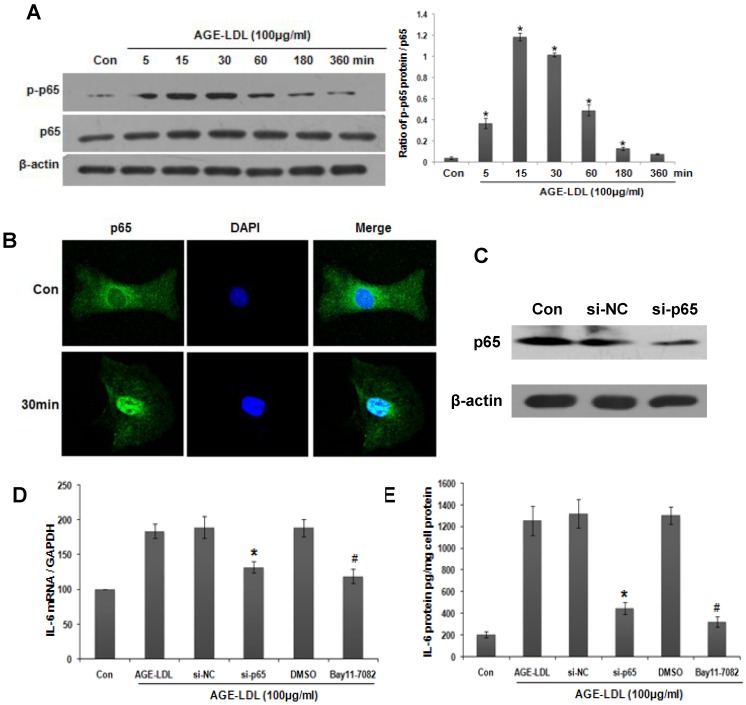
Figure 7.
Activation of NF-κB was responsible for AGE-LDL induced IL-6 expression. (A) HK-2 cells were treated with 100μg/ml AGE-LDL for indicated time period. The phosphorylation level and the total protein level of p65 were determined by western blot. *P<0.05 versus control cells. Data are expressed as mean±SD of three independent experiments. (B) The translocation of p65 into nuclei was examined by immunofluorescence staining. HK-2 cells were treated with 100μg/ml AGE-LDL for 30 min, and then stained with antibody against p65 (green). Nuclei were stained with DAPI (blue). Images were taken by confocal microscopy. Magnification 400x. (C) HK-2 cells were transfected with p65 siRNA and the protein level of endogenous p65 was determined by western blot. (D-E) HK-2 cells were either transfected with p65 siRNA or treated with NF-κB inhibitor (Bay11-7082, 10μM) before AGE-LDL stimulation. IL-6 production was measured by real time PCR (D) and ELISA (E). *P<0.05 versus scramble siRNA transfected cells. #P<0.05 versus DMSO vehicle control cells. Data are expressed as mean±SD of three independent experiments.

