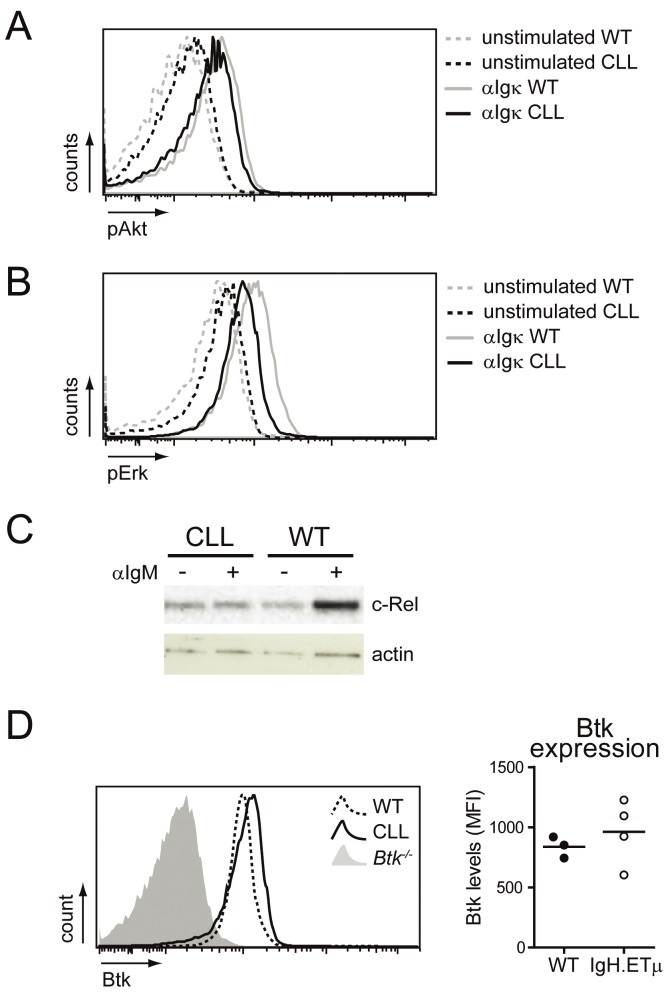
Figure 1.
Altered activation of downstream BCR signaling pathways in IgH.ETμ tumors. Flow cytometric measurement of phosphorylation of Akt (A) and Erk (B) upon BCR stimulation in IgH.ETμ CLL cells versus wild-type (WT) B cells. MACS-purified CD19+ cells were stimulated for 5 minutes with 20 μg/mL goat anti-mouse Igκ and subsequently stained for phosphorylated Akt or Erk. C: Protein levels of c-Rel determined by western blotting in nuclear lysates of unstimulated (-) and αIgM stimulated (+) CD19+ MACS-sorted CLL cells and wild-type (WT) splenic B cells. D: Left: Btk expression levels in gated CD19+ wild-type (WT) splenic cells versus IgH.ETμ CLL cells were evaluated using flow cytometry. Background staining levels were determined in Btk-/- cells. Right: flow cytometric determination of median Btk expression levels in wild-type (filled circles) and IgH.ETμ CLL cells (open circles). MFI: median fluorescence intensity. For all analyses at least 4 CLL samples and 3 wild-type splenic B cell fractions were included; representative results are shown.

