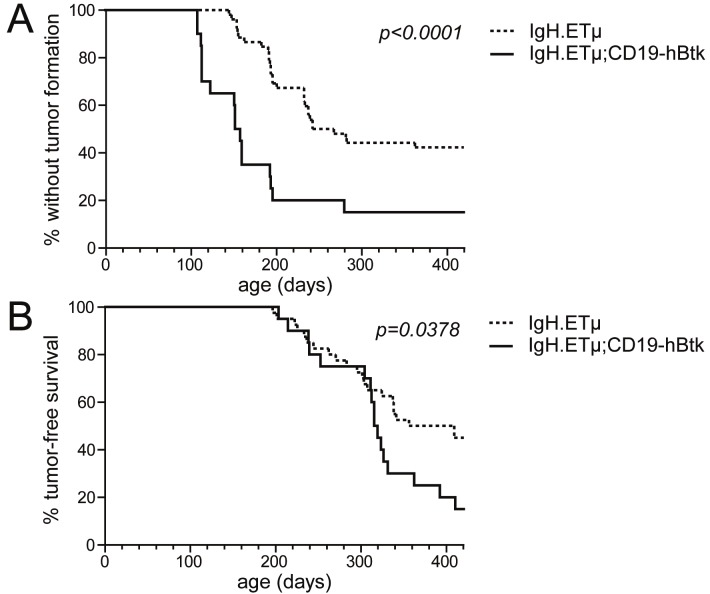
Figure 3.
Btk overexpression enhances CLL formation. A: Incidence curve of CLL formation in IgH.ETμ mice (dotted line; n=40) versus CD19-hBtk transgenic IgH.ETμ mice (continuous line; n=20). CLL formation was defined by the first appearance of monoclonal IgMb+ B cells in peripheral blood of these mice (IgMb+:IgMa+ ratio > 80:20 [21]). B: Kaplan-Meier survival curve of IgH.ETμ;CD19-hBtk mice (continuous line; n=20) versus IgH.ETμ non-CD19-hBtk transgenic mice (dotted line; n=40).

