
Figure 1.
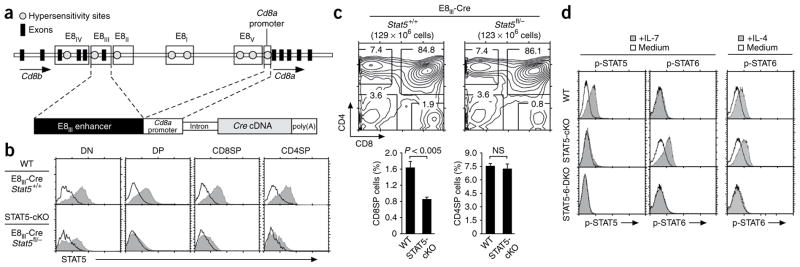
Impaired CD8+ T cell generation in Stat5a- and Stat5b-deficient mice. (a) The E8III-Cre transgene consists of enhancer and promoter elements from Cd8a that drive expression of Cre cDNA. (b) STAT5 protein content of thymocytes from wild-type (WT) and STAT5-cKO mice, assessed by intracellular staining with anti-STAT5 (shaded histograms) or control antibodies (open histograms). Data are representative of seven experiments. (c) Flow cytometry analysis (top) and frequencies of TCRhiCD4+ and TCRhiCD8+ SP thymocytes (bottom) in wild-type and STAT5-cKO mice. Numbers above plots indicate total thymocytes; numbers in outlined areas indicate percent cells in each. P value, Student’s two-tailed t-test; NS, not significant. Data are a summary of seven independent experiments with at least seven mice of each genotype (bottom; mean and s.e.m.). (d) Intracellular staining of phosphorylated STAT5 (p-STAT5) and phosphorylated STAT6 (p-STAT6) in lymph node T cells from wild-type, STAT5-cKO and STAT5-6-DKO mice after overnight stimulation with medium alone or with IL-7 (1 ng/ml) or IL-4 (10 ng/ml). Data are representative of three experiments.