Fig. 5.
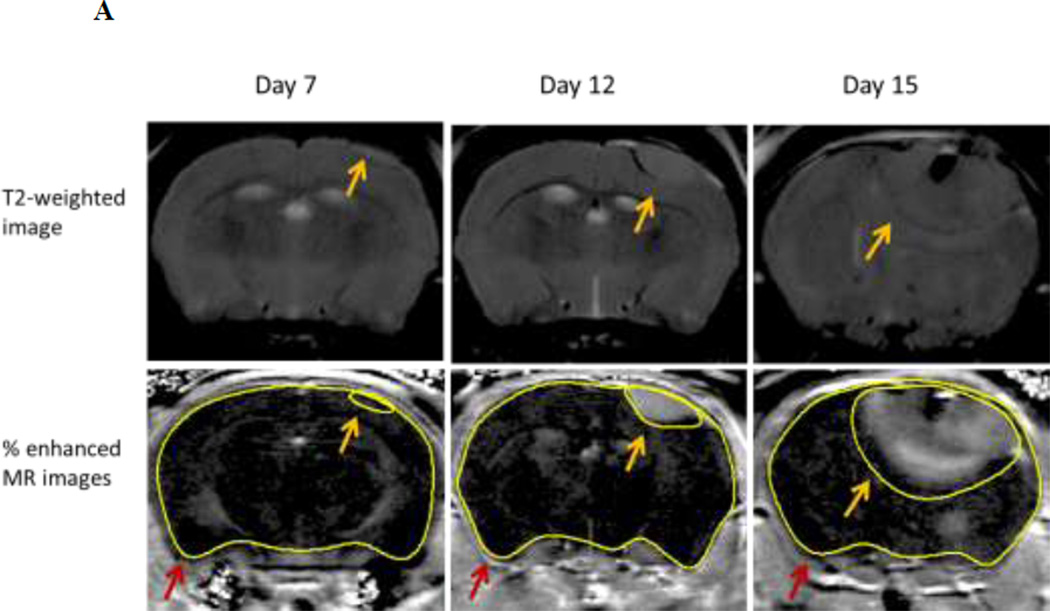
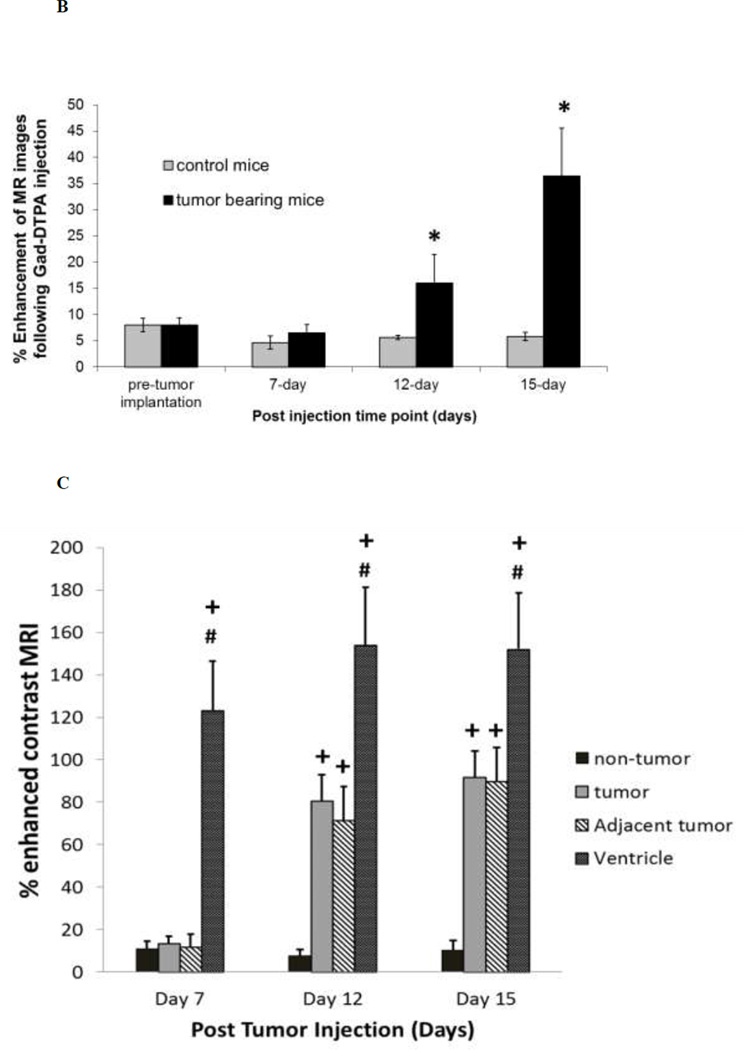
Enhancement of MR images following Gad-DTPA injection in brain and brain tumor mice. Panel A – Representative of % enhanced MR images from a tumor bearing mouse at day 7, day 12 and day 15 post tumor cell implantation. Images are from the same mouse at a region near the initial tumor cell injection site. Tumor and brain region were determined from T2-weighted images (Top Panel) and highlighted as indicated by the yellow and red arrows respectively. Panel B – Percent enhancement of MR images following Gad-DTPA at different time points after the induction of tumor compared to sham (control) mice. Panel C – Percent-enhanced Gad-DTPA MR images from various brain regions of interest in tumor bearing mice at different stages of tumor growth. Tumor area was determined from T2-weighted MRI. Non-tumor regions were taken from the contralateral hemisphere as well as circumventricular regions around the third ventricle. Each data point is the mean ± SEM of 4–8 mice. Data from tumor and control mice as well as from various areas of interest within tumor mice were analyzed using ANOVA, * p < 0.05 compared to control mice; + p < 0.05 compared to non-tumor; # p<0.05 compared to tumor.


