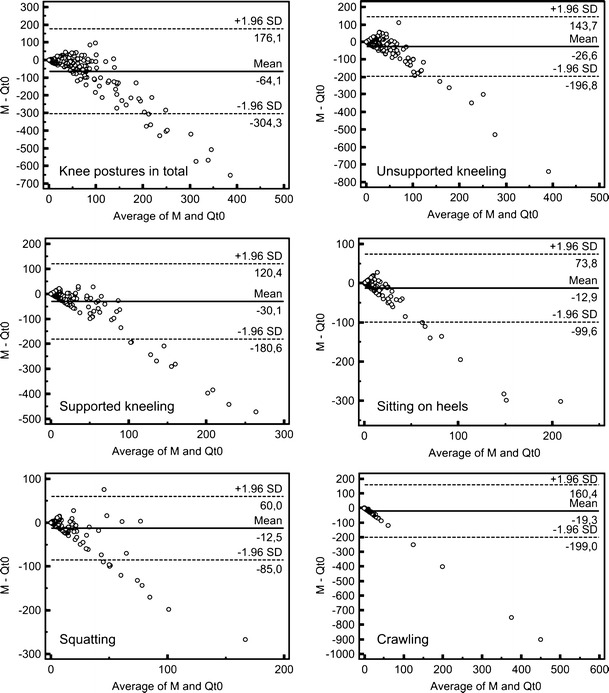
Fig. 3.

Bland–Altman plots for the comparison of measurement and Qt 0, showing all examined knee postures [min] (for better illustration, outliers (Qt 0 > 1,000 min) were excluded); sample sizes: knee postures in total (182), unsupported kneeling (189), supported kneeling (189), sitting on heels (190), squatting (190), and crawling (190)
