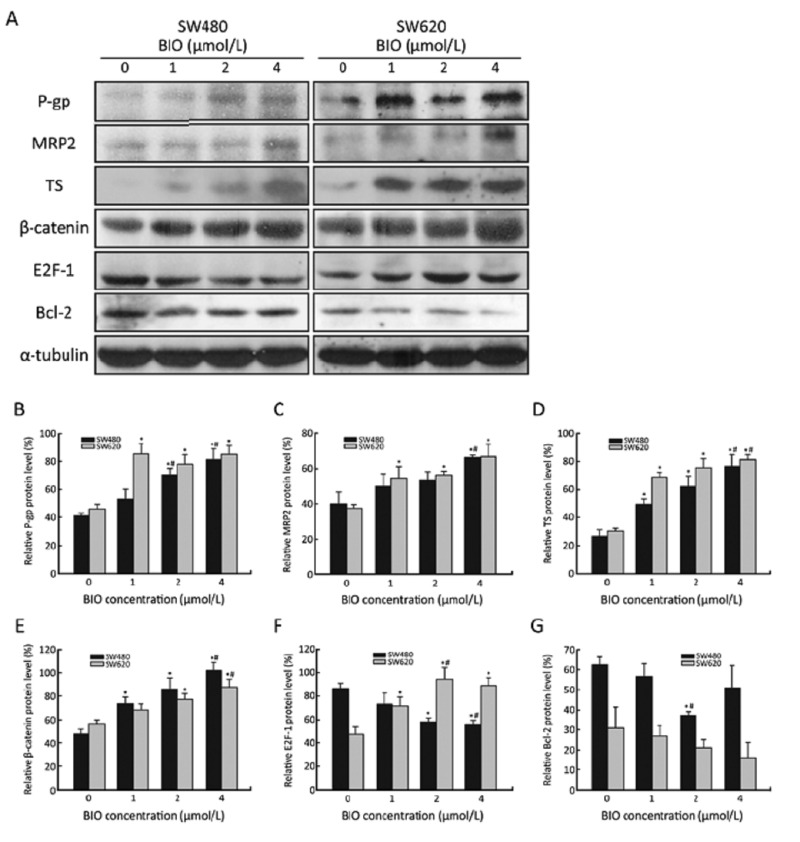
Figure 3.
Expression levels of P-gp, MRP2, TS, β-catenin, E2F-1 and Bcl-2 in SW480 and SW620 cells before and after BIO treatment for 24 h. A: Protein expression by Western blot in SW480 and SW620 cells. α-tubulin was used as an internal loading control. B–G: The density of the protein band was quantitated using Quantity One software (Bio-Rad, USA). Values are expressed as protein/α-tubulin. The data are expressed as‾x±s of three experiments. *P<0.05 compared with the control (0 μmol/L); #P<0.05 compared with BIO-treated cells (1 μmol/L).

