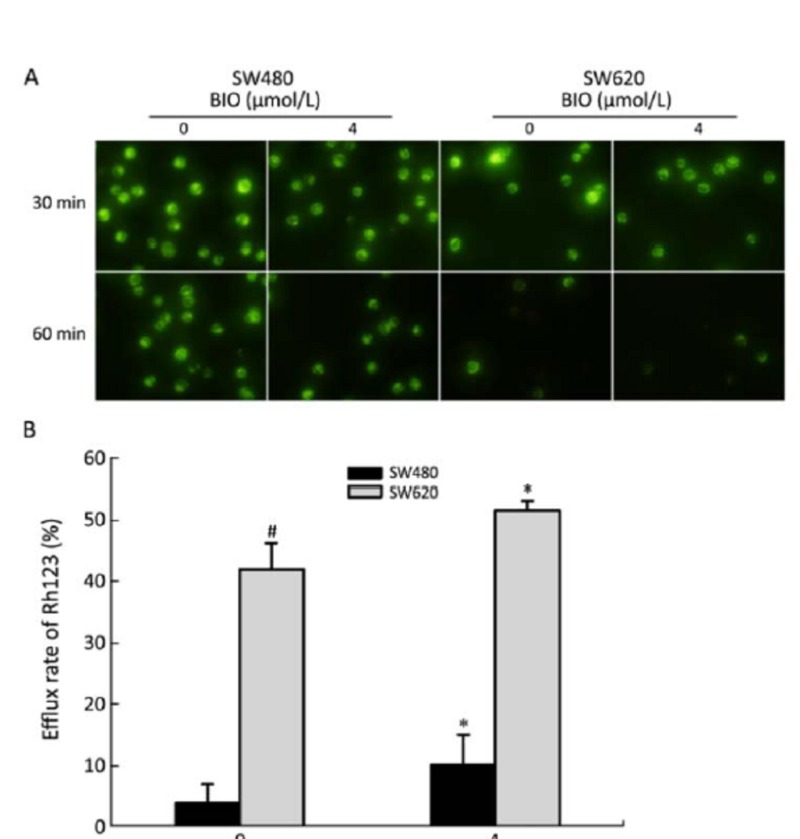
Figure 5.
The effects of BIO on efflux of Rh123 in SW480 and SW620 cells. A: The fluorescent signals of Rh123 before and after BIO treatment were observed by fluorescent microscope (×400) in SW480 and SW620 cells. B: The efflux rate of Rh123 before and after BIO treatment in SW480 and SW620 cells. All values are presented as‾x±s of three experi- ments. *P<0.05 compared with the control (0 μmol/L). #P<0.05 compared with SW480 (0 μmol/L).

