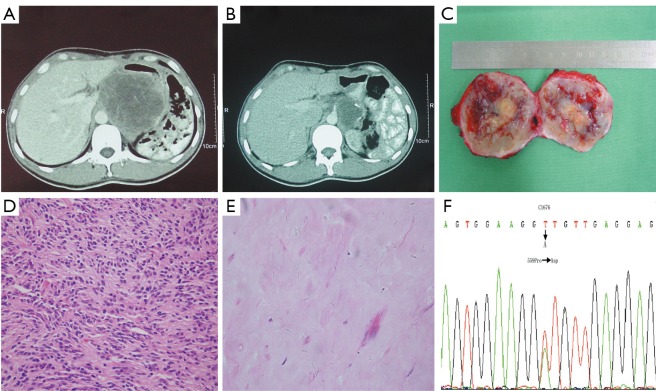
Figure 3.
Comparison of pre- and post-imatinib CT scan and tumour tissue in a recurrent GIST undergoing preoperative imatinib therapy. A. CT scan before imatinib therapy revealed a tumour located between the residual stomach and liver, adhering to the inferior caval vein,about 10 cm in diameter; B. CT scan after 6 months of preoperative imatinib therapy demonstrates a 6 cm in diameter sized residual tumour; C. gross specimen after imatinib therapy demonstrating necrosis nodule and bleeding in the tumor; D. biopsy specimen from the first resection of gastric GIST, before preoperative imatinib treatment showing been composed of affluent spindle cells, H&E 200; E. representative section of the tumour mass after imatinib therapy showing much collagen with hyaline degeneration, H&E 400; F. tumour cells before and after imatinib therapy show the same (C1676 T→A) was detected in exon 11 of the KIT gene

