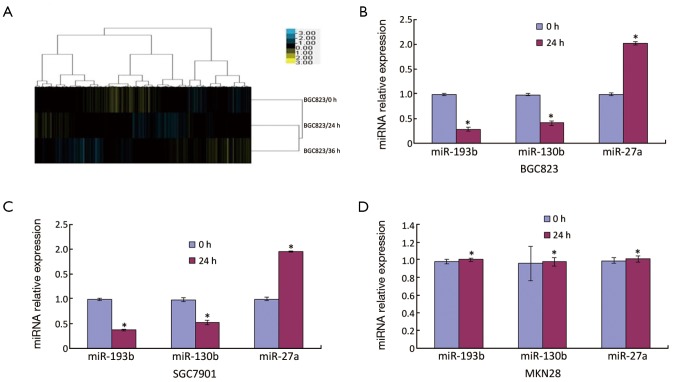
Figure 1.
miRNA alternation induced by TGF-β1 treatment (n=3). A. The miRNA microarray clustering results of BGC823/0 h, BGC823/24 hrs and BGC823/36 hrs cell lines; B. qRT-PCR analysis of the relative expression levels of miR-193b, miR-130b and miR-27a in the same sample used for microarrays; C. qRT-PCR analysis of relative expression levels of miR-193b, miR-130b and miR-27a in SGC7901 cell lines; D. qRT-PCR analysis of relative expression levels of miR-193b, miR-130b and miR-27a in MKN28 cell lines. U6 RNA expression was used for normalization. *P<0.05

