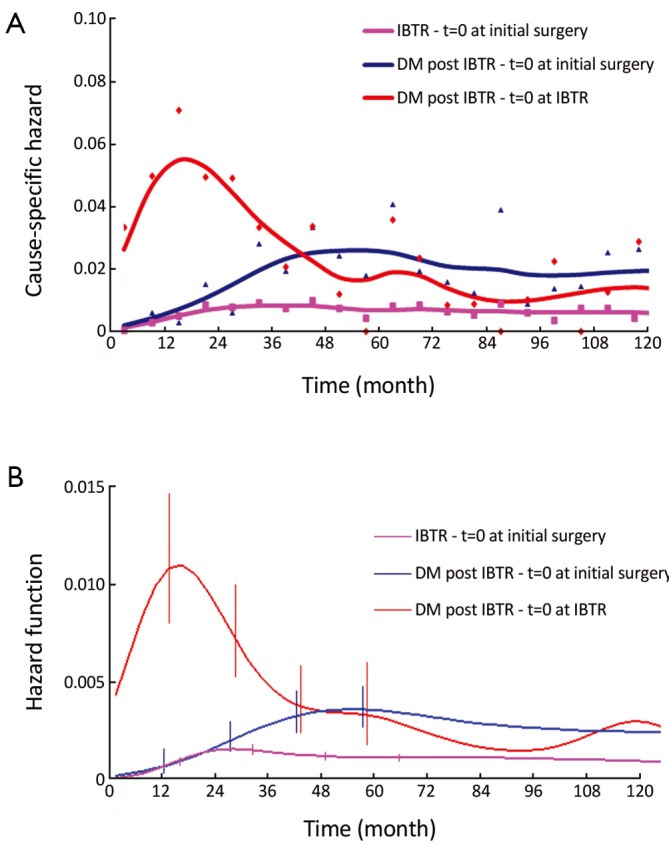
Figure 1.

Cause-specific hazard rate estimates for recurrence following IBTR diagnosis and surgical treatment in 338 patients, time origin at primary surgery (blue line) and at the surgical removal of IBTR (red line). The hazard rate estimates for IBTR occurrence with time origin at primary surgery (fuchsia line) are also reported. A. Hazard rate within a six month interval. Smoothed curves obtained by a Kernel-like smoothing procedure. Standard deviation estimates for single points are also reported; B. One month basis hazard rate obtained by the formal regression approach described in the Methods section. Vertical lines represent 95% point-wise confidence interval
