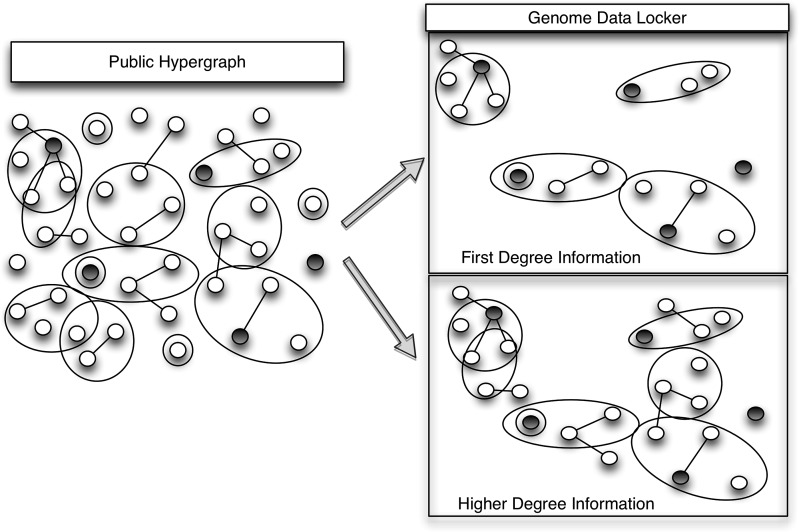
Figure 3.
The network on the left is an example knowledge network platform. The darkened nodes represent gene variants present in an individual genome. The network on the top right is a genome-induced subgraph of the network. The network on the bottom right is a genome-induced subgraph, expanded out to include additional knowledge stored on edges in the connected-component each data element is contained in.

