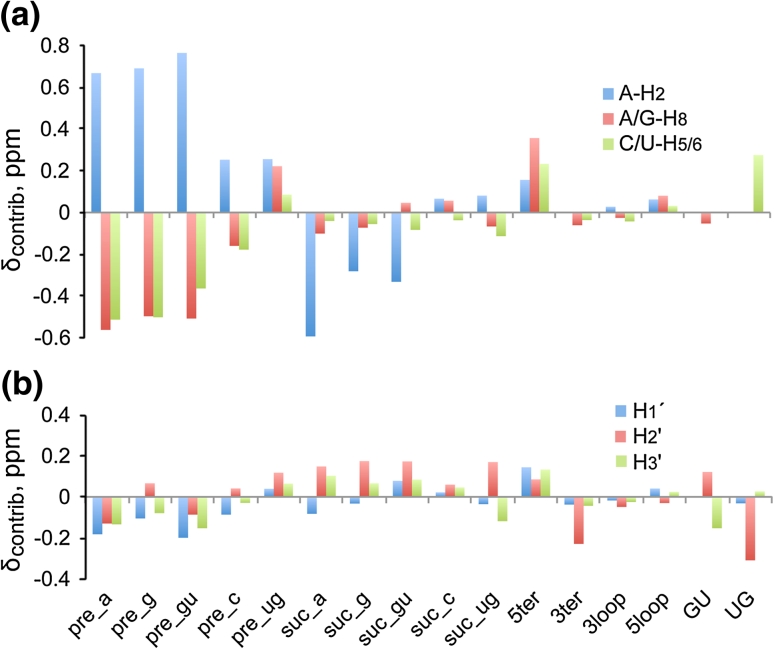
Fig. 4.
Plot of the chemical shift contributions (δcontrib) of each attribute relative to a canonical uNu triplet as obtained via Pace Regression for aromatic (a) and ribose (b) proton assignments (positive values denote downfield shifts). Data in these plots are derived from Table 1. For simplification, data for aromatic protons with similar trends in their response to the attributes were combined, and within each group of proton type, the largest absolute value is plotted. Because this procedure can mask the details of individual proton types one should use this plot for observing general trends and refer to the specific contributions in Table 1

