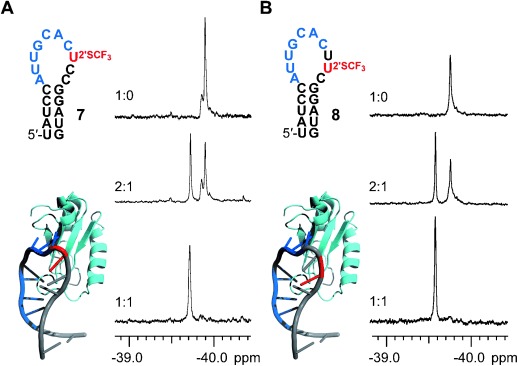
Figure 4.

Characterization of an RNA–protein interaction. A) left: RNA stem–loop 7 with 2′-SCF3 label (red) and the recognition sequence (blue) for the U1 A protein (cyan), Pymol model generated from 3CUL (Protein Data Bank); right: 19F NMR spectra of RNA and U1 A RBD19 mixed at different ratios as indicated. B) Same as (A), but with label (red) at different position. Conditions: [RNA]=0.3 mm, [protein]=0.3 mm, [Na2HPO4]=10 mm, pH 6.0, H2O/D2O=9:1, 298 K.
