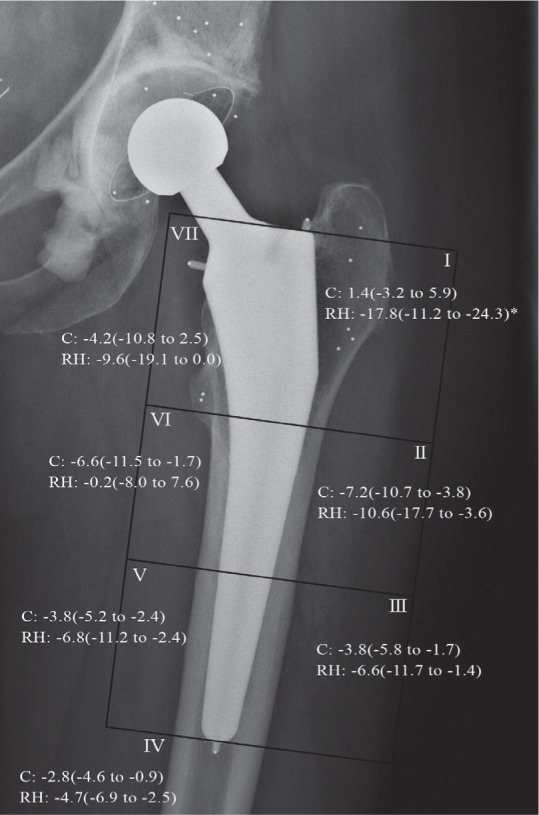
Figure 3.

Mean percentage changes in BMD relative to postoperatively in Gruen zones 1–7 at 2 years, with 95% CI of mean. * Statistically significant difference in zone I (p < 0.001, independent-samples Mann-Whitney U test). RH: reverse hybrid; C: cemented.
