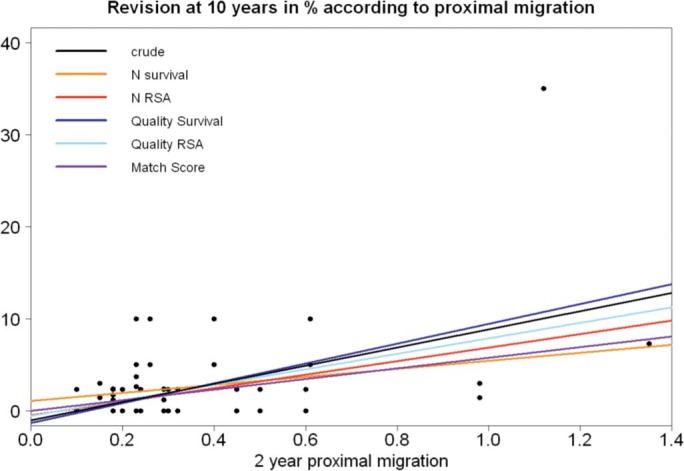
Figure 2.

Scatter plot showing association between 2-year proximal migration in mm and revision rate for aseptic loosening of the acetabular cup at 10 years, as a percentage. The colored lines were derived from weighted regression according to match quality, survival study quality, and RSA study quality (the coefficients and 95% CIs are given in Table 2).
