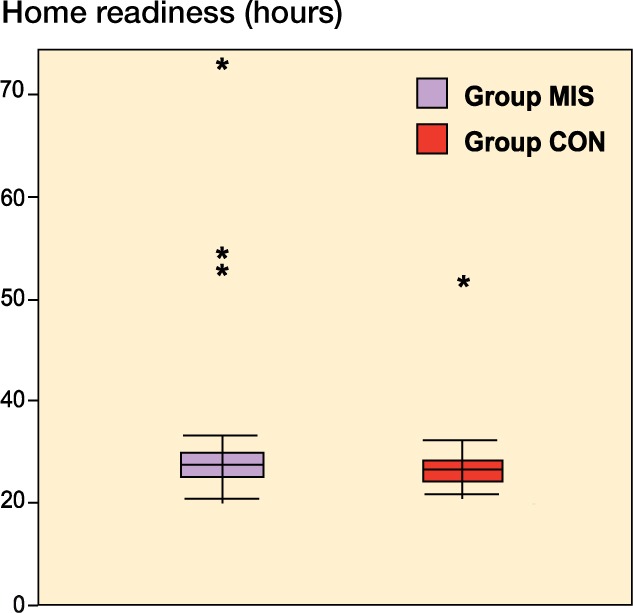
Figure 2.

Home-readiness (time to fulfillment of all discharge criteria) is presented as median and interquartile range (IQR). The asterisks represent outliers with scores of more than 3 times the IQR. No statistically significant difference was found between the groups.
