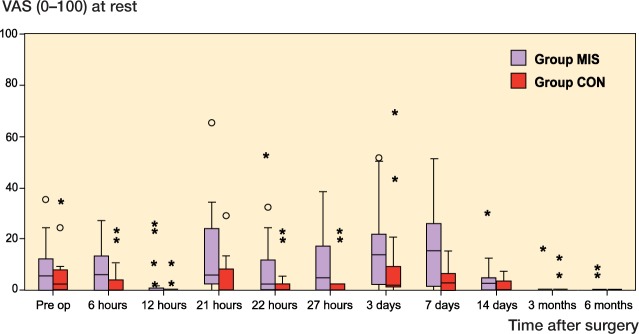
Figure 3.

Pain at rest assessed using VAS and presented as median and interquartile range. The circles represent outliers with scores of more than 1.5 times the IQR, and the asterisks represent outliers with scores of more than 3 times the IQR. No statistically significant differences were found between the groups.
