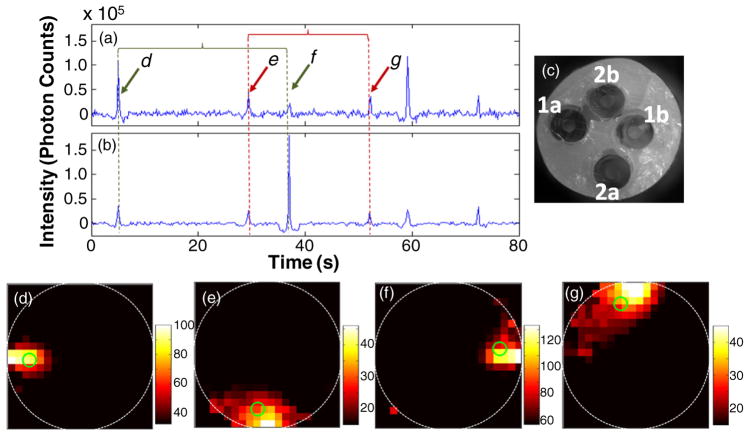
Figure 5.
Example data acquired when the first (a) and second (b) lasers were illuminating a flow phantom. As shown in the white-light cross-sectional image (c), this phantom was fabricated with two tubes embedded, the first approximately along the left and then right edges of the phantom (labeled 1a and 1b) and the second along the bottom and top edges (2a and 2b). Example fluorescence reconstructions (d)–(g) when a microsphere was traveling through each of the four flow channels. The centroid of each reconstruction is marked with a green circle. Example reconstructed data set for this flow phantom is shown in supplemental video 3 available at stacks.iop.org/PMB/57/4627/mmedia.

