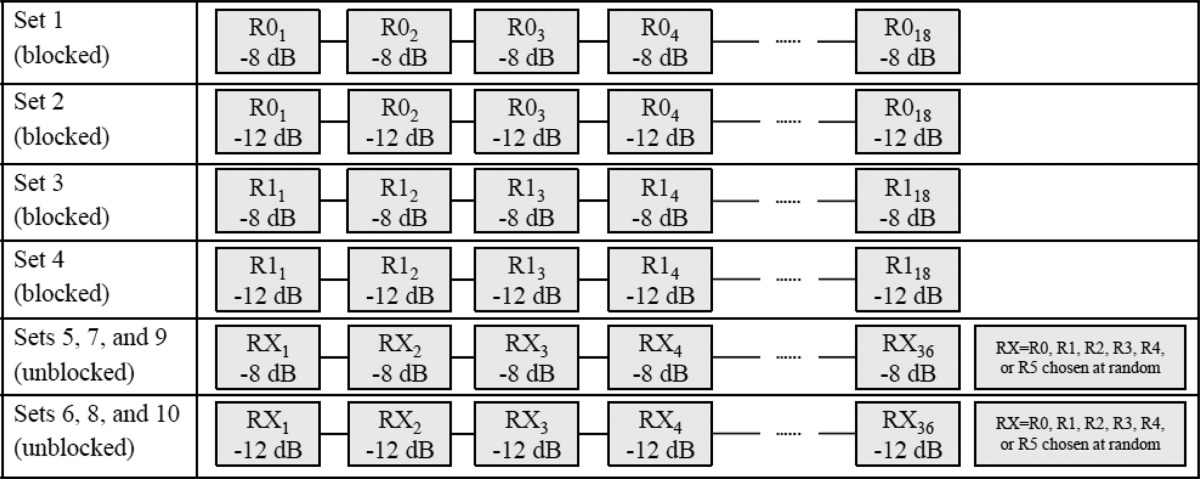
Table 1.
Block diagram illustrating the experimental design. A sequence of trials is shown for each set, where R0 denotes speech presented in anechoic listening environment and R1 denotes speech presented in a simulated reverberant listening environment (T60 = 0.3 s). Signal-to-noise ratio (SNR) is indicated (in dB) for each trial. Sets 1–4 (18 trials each) were blocked by room. In the remaining unblocked sets (36 trials each), room was selected at random (equal probability) from a set of six rooms, which included R0 and R1.
 |
