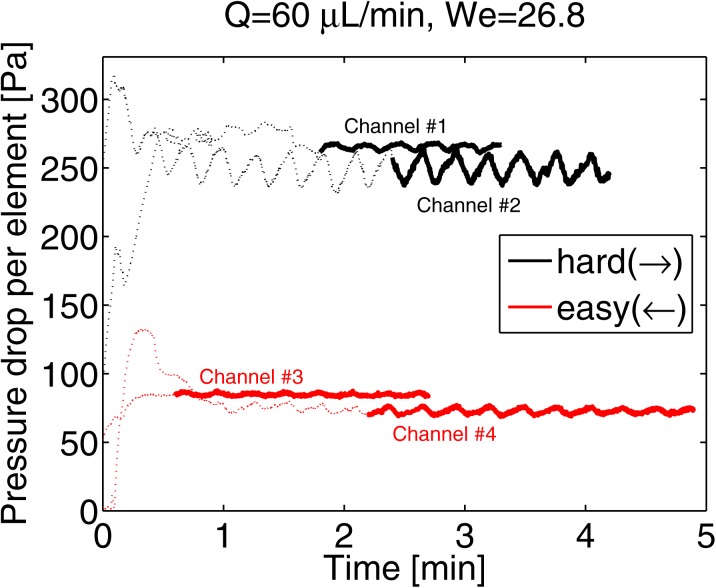
Figure 2.
Measured pressure drop as a function of time for four experiments, two in each flow direction. The thick curves correspond to the data used to calculate averaged values. Oscillations in the sensor signal with a period much longer than fluid relaxation time occur, but the effect of blocking exceeds the error related to the averaging of these oscillations.

