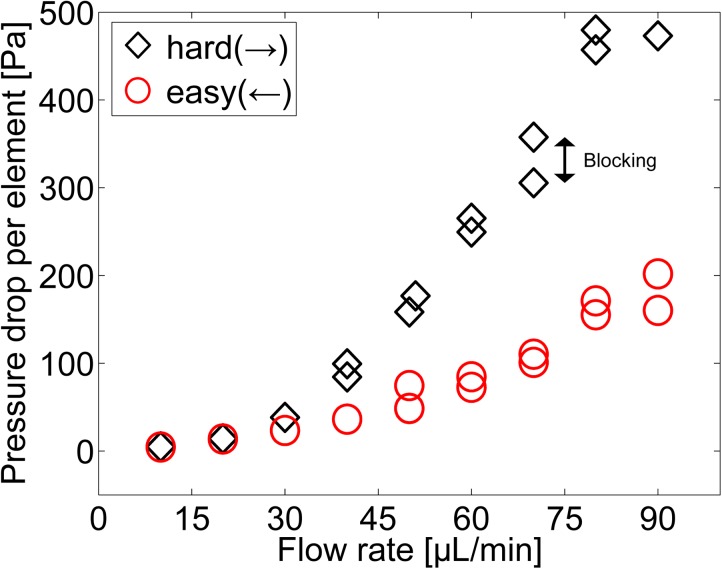
Figure 5.
Pressure drop per element as function of the flow rate for the two flow directions. The effect of blocking is illustrated by repeated measurements at the same flow rate indicating that the effect of the flow direction dominates. Altogether the figure represents data from seven microchannels, but around 70 channels were fabricated and tested in total.

