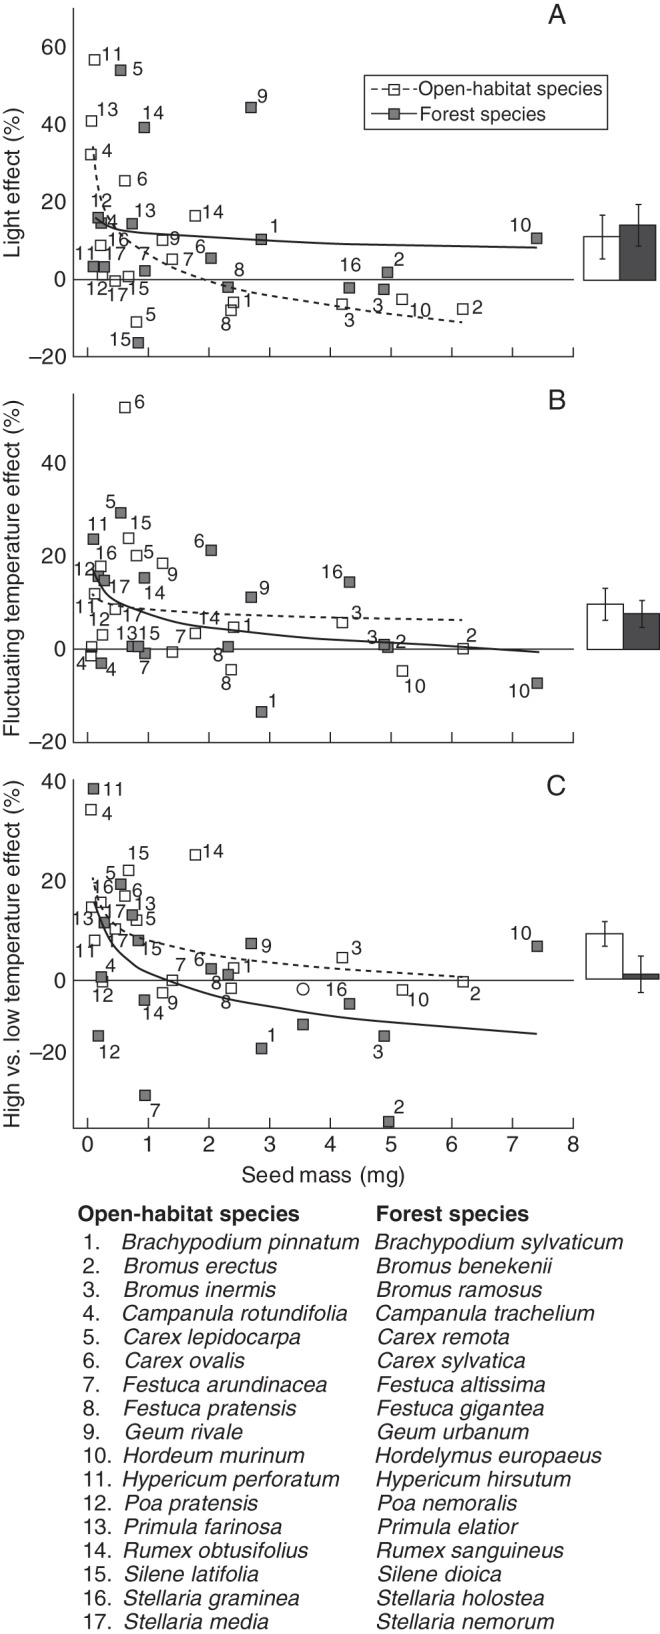
Fig. 1.

The absolute difference in germination response between light vs. darkness, fluctuating vs. constant temperature, and high vs. low temperatures are shown in relation to seed mass for all species in the experiment. The effects are calculated as percentage germination in light minus percentage germination in darkness, etc. The bars to the right of each scatter graph show means ± s.e. error for all open-habitat and forest species in that graph. Trend lines are logarithmic.
