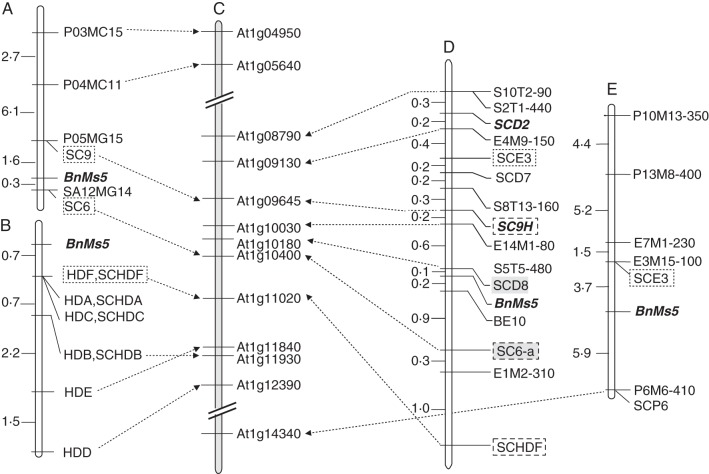
Fig. 2.
Genetic map integration of BnMs5 and its comparison with Arabidopsis. (A) The genetic map published by Song (2006b); (B) the genetic map published by Hong et al. (2006); (C) the schematic distribution of Arabidopsis genes on chromosome 1 orthologous to the BnMs5-linked markers; (D) the integrated and refined genetic map; (E) the genetic map published by Lu et al. (2004). Dotted lines with a single arrow indicate the corresponding relationship between the polymorphic markers and their orthologues. Markers in (D) indicated by grey bars were used as probes for BAC library screening. Three markers integrated into D are shown by dashed-line boxes. The bold and italic markers were mapped on the A8 chromosome of the TNDH genetic map. Genetic distances are shown in cM.

