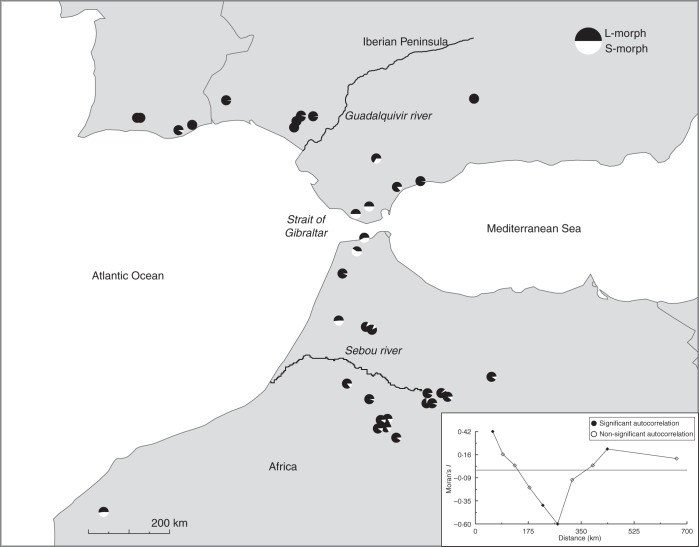
Fig. 1.
Distribution and morph-ratio variation of 34 populations of Narcissus papyraceus in the Guadalquivir river basin, Strait of Gibraltar and Sebou river basin. Each pie chart represents the morph ratio in a population (black = L-morph; white = S-morph). Moran's I correlogram of morph-ratio variation is shown in the inset graph (significant and non-significant autocorrelation coefficients as indicated, calculated from their moments; see PASSaGE v. 1·1 manual; Rosenberg, 2004).

