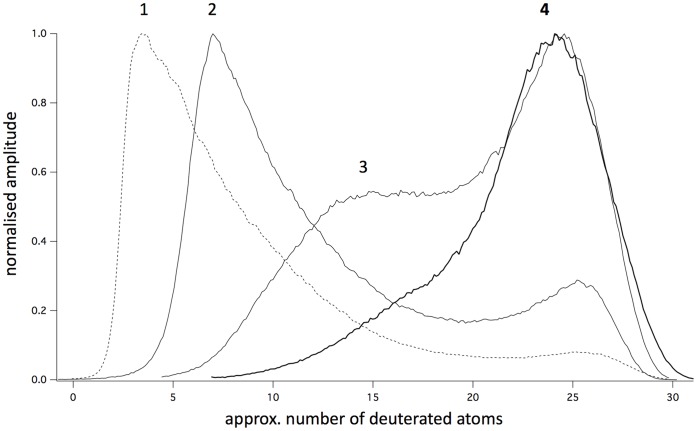
Figure 3. GC elution profiles of partially deuterated cyclopentadecanone samples.
The GC traces have been normalised to a peak amplitude of 1 and are shown plotted against approximate deuteration number rather than retention time as in figure 2. The deuteration scale is taken from mass spectra taken at different times and differs slightly between one sample and the next because of slight differences in the GC elution times. The abscissa should therefore be taken as approximate, i.e +/−2 deuterated atoms. Trace 4 [bold] is taken from figure 2 A. The sample depicted in trace 1 had no discernible burnt odor character.

