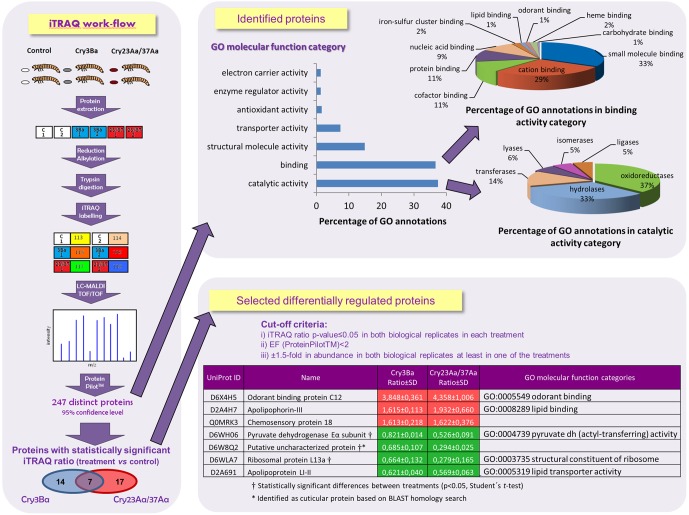
Figure 2. Quantitative iTRAQ proteomic analysis.
A work-flow indicating the steps followed in the iTRAQ analysis performed on two biological replicates of each toxin treatment and the classification of the iTRAQ identified proteins according to GO molecular function categories are shown. Proteins showing an i-TRAQ ratio (treatment vs control) with a Protein Pilot p-value≤0.05 at least in one replicate sample were 21 in Cry3Ba spore-crystal treated larvae and 24 in Cry23Aa/Cry37Aa spore-crystal treated larvae. Seven differentially regulated proteins are listed for Cry3Ba and Cry23Aa/Cry37Aa treatments and were selected according to the following cut-off criteria: (i) i-TRAQ ratio p-value≤0.05 in both biological replicates in each treatment, (ii) error factor <2 (generated by ProteinPilotTM), (iii) an average of ±1.5-fold in abundance in response to Bt intoxication in both biological replicates at least in one of the treatments. Using Student's t-test, statistically significant differences between toxin treatments were detected for pyruvate dehydrogenase Eα subunit, cuticular protein and ribosomal protein L13a (p<0.05).

