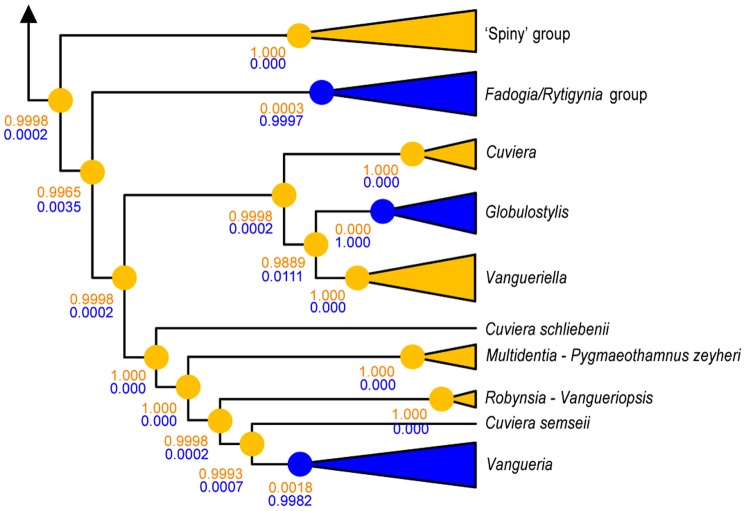
Figure 3. Optimization of the Vanguerieae-Burkholderia interaction on a simplified representation of the host plant tree.
In Vanguerieae, the association with Burkholderia endophytes has occurred three times independently (blue clades). The circles are pie charts that represent the chance of presence and absence of endophytes per node. However, because the Bayesian posterior probabilities are so high, they are or completely yellow (absence of endophytes) or completely blue (presence of endophytes). Support values for either absence (yellow) or presence (blue) are indicated below the nodes.

