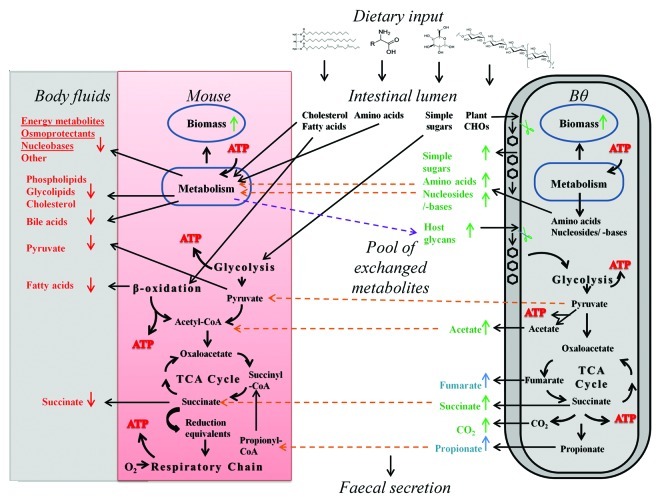
Figure 2. Metabolite dependency of mouse and B. thetaiotaomicron in iexGFMM_BΘ. On a Western diet, changes in flux rates in iexGFMM_BΘ, when maximizing for mouse growth rate, were compared with those in the maximally growing germfree mouse model and depicted by arrows (up: increased flux, down: decreased flux compared with germfree mouse). For simplicity not all observed changes and related pathways are shown. Metabolites with increased exchange flux compared with the germfree model are shown in green, while metabolites with reduced exchange flux are shown in red. Metabolites that only secreted in iexGFMM_BΘ are shown in blue. Orange arrows indicate metabolites that B. thetaiotaomicron provides to the mouse. Purple arrows indicate mouse metabolites provided to B. thetaiotaomicron. CHO, carbohydrate; Bas, bile acids; TCA cycle, tricarboxylic acid cycle; = B. thetaiotaomicron’s polysaccharide- degrading enzyme repertoire.

An official website of the United States government
Here's how you know
Official websites use .gov
A
.gov website belongs to an official
government organization in the United States.
Secure .gov websites use HTTPS
A lock (
) or https:// means you've safely
connected to the .gov website. Share sensitive
information only on official, secure websites.
