
Figure 5. Photomicrographs of IHC stain of ER and HER2 expression and western blotting analyses of ER-expression and response to E2 in breast cancer cell lines.
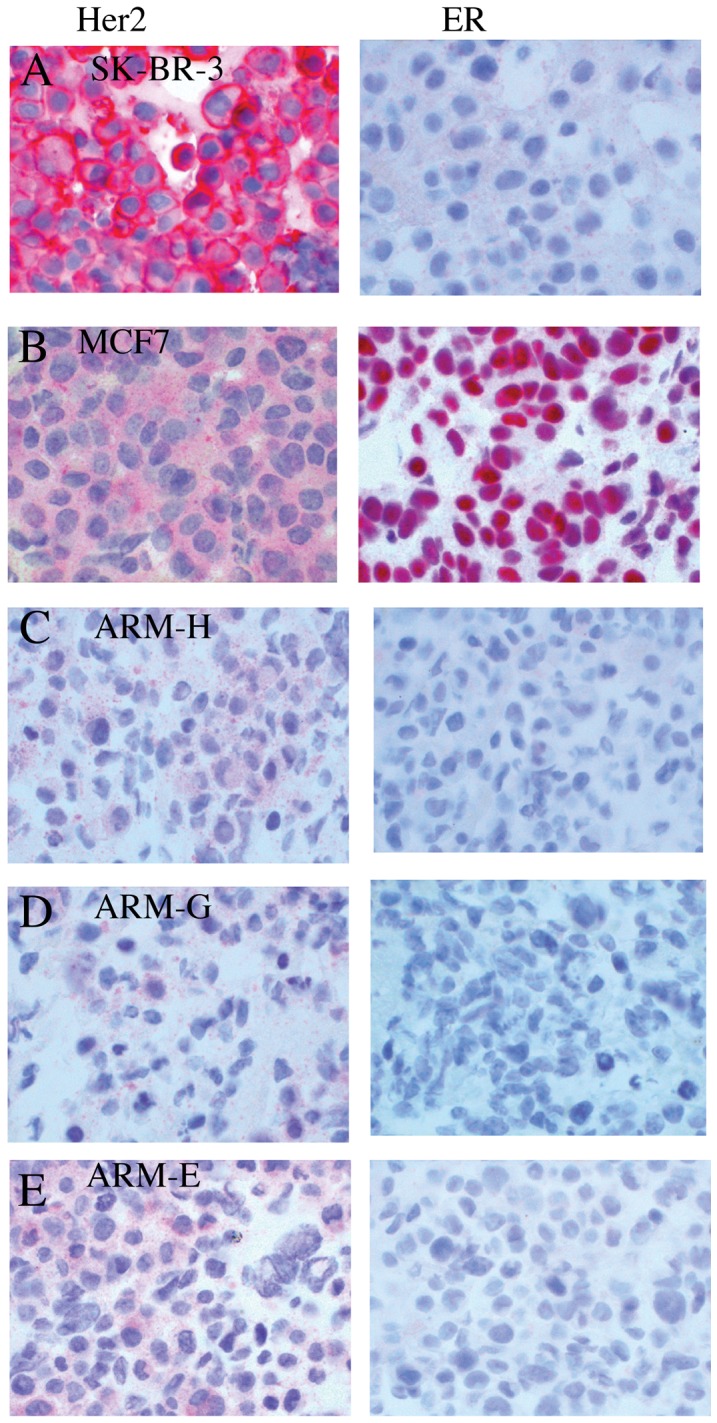
(A) SK-BR-3 (B) MCF-7 (C) ARM-H (D) ARM-G (E) ARM-E cell lines.
Official websites use .gov
A
.gov website belongs to an official
government organization in the United States.
Secure .gov websites use HTTPS
A lock (
) or https:// means you've safely
connected to the .gov website. Share sensitive
information only on official, secure websites.
(A) SK-BR-3 (B) MCF-7 (C) ARM-H (D) ARM-G (E) ARM-E cell lines.