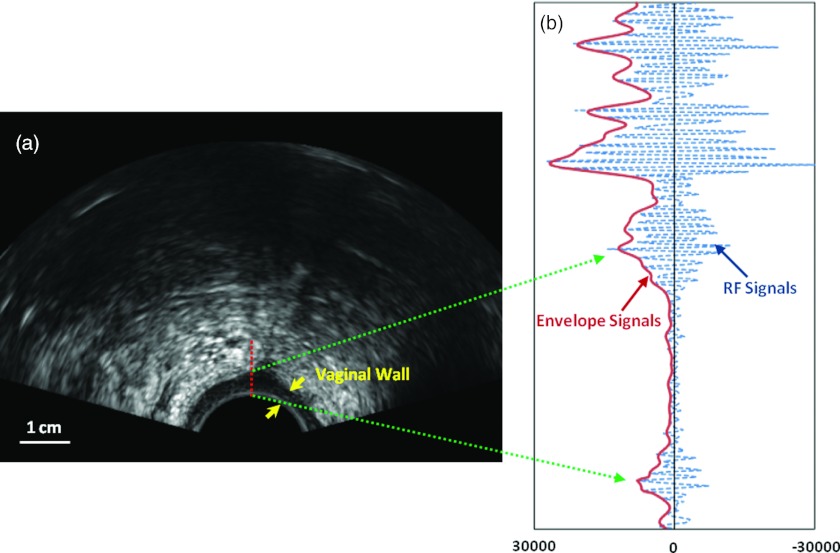
Figure 1.
Ultrasound B-mode image and RF signals. (a) Transvaginal ultrasound B-mode image. The vaginal wall is clearly visualized (arrows). (b) RF echo signals (in dotted line) and envelope signals (in solid line) of part of the central line. The Nakagami parameter method is based on analysis of the envelope signals.

