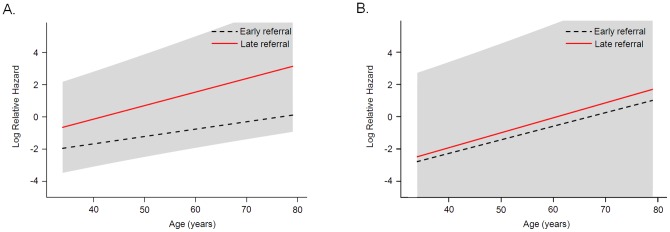
Figure 3. Relationship between log relative hazard for mortality and age according to timing of referral.

(A) Total patients, adjusted for age, gender, modified CCI, BMI, eGFR, serum hemoglobin, calcium, iPTH, uric acid, triglycerides, total cholesterol, and HDL cholesterol. (B) DM ESRD patients, adjusted for age, gender, modified CCI, BMI, eGFR, serum hemoglobin, calcium, iPTH, uric acid, triglycerides, total cholesterol, and HDL cholesterol.
