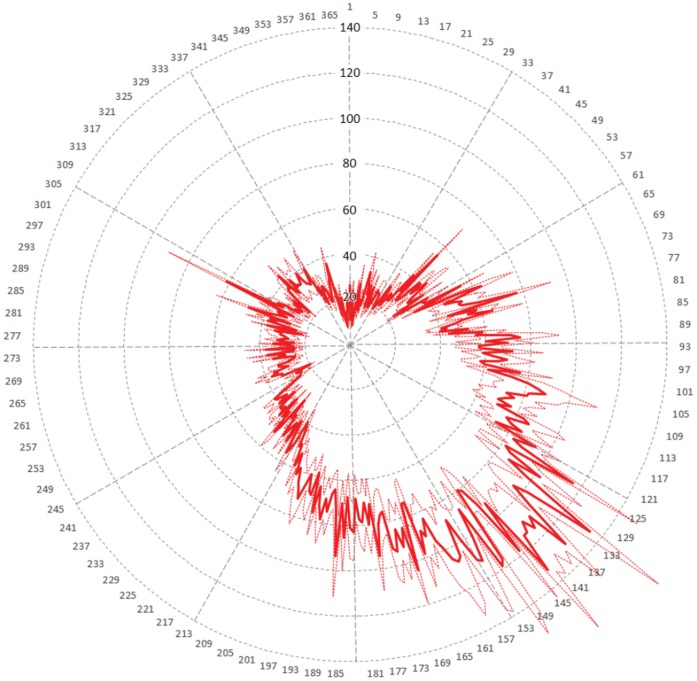
Figure 8. Average distribution of records within years.
Year rank is from 1750 to 2011. Solid line represents average number of records and dotted lines represent standard error of the mean. Radii mark the first day of each month. Day of year is numbered 1–366; non-leap years lack day 60. There is a high record bias towards spring/summer.

