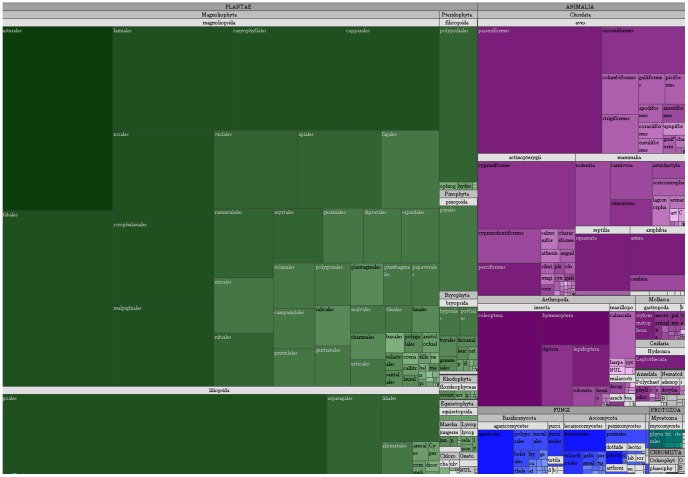
Figure 12. Nested surface map (tree map) of the taxonomy of GBIF.ES.
Each cell belongs to a taxonomic order and is nested into a class cell; this is nested into a phylum/division cell, which is nested into a kingdom cell. The area of the cell is proportional to the number of records. Color hue represents kingdom. Color shade is proportional to the binary log of the number of different taxon strings (i.e., combinations of taxon level-specific names from kingdom to species) supplied by the providers for each order. (Darker is more).

