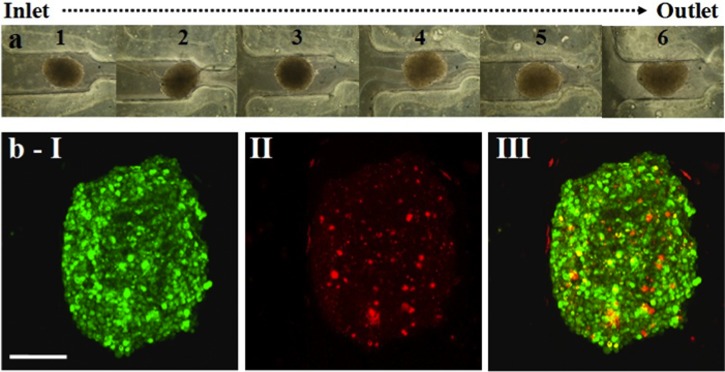
Figure 3.
Spheroid loading and live-dead cell imaging. (a) Phase contrast images of six TOV112D spheroids entrapped in a single microfluidic device. These spheroids were subjected to live-dead imaging by dual fluorescent staining technique. (b) Confocal image of a CTG-PI stained spheroid, as projected over 15 confocal z-sections across the spheroid height. (b-I): CTG (green fluorescent). (b-II) PI (red fluorescent). (b-III) CTG-PI merged channels. Note that PI monitored cell death is minimal and is evenly distributed spatially. Scale bar represents 120 μm.

