Figure 4.
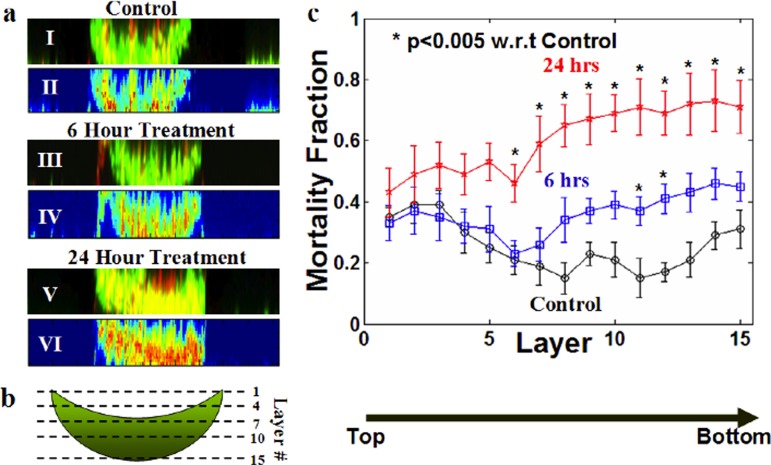
Distribution and temporal evolution of the mortality fraction. (a) Representative side view images of CTG-PI labeled TOV112D spheroids after 0, 6, and 24 h of incubation with 10× the TOV112D reference IC50 of carboplatin. I, III, and V illustrate merged confocal images while II, IV, and VI are corresponding pseudo-color images highlighting the distribution of mortality, in which red represents high mortality. Note that red intensity is more prominent with increased treatment time (compare 6 to 24 h). (b) Graphical representation of the imaging scheme. From top to bottom, 15 different cross-sectional images (termed image layers) were acquired for each spheroid. (c) Distribution of mortality fraction (number of dead cells/total number of cells in a single section) across 15 image layers comparing controls and spheroids treated with 10× the TOV112D monolayer IC50 of carboplatin for 6 or 24 h. Data are averaged over three independent experiments (total number of samples, n = 16) and shown as mean ± standard deviation.

