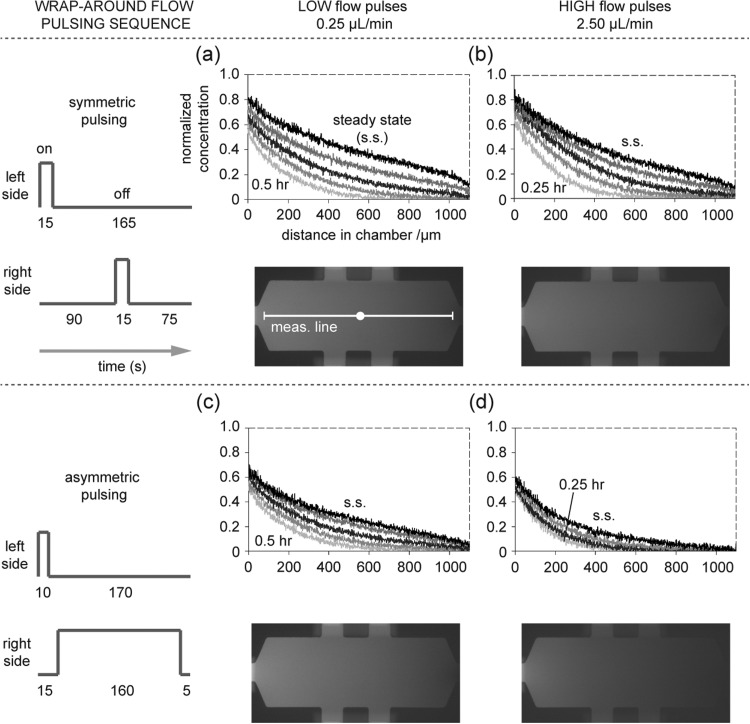
Figure 2.
Gradient formation measured via fluorescence imaging. Top-most profile in each graph is the stable, steady-state (s.s.) profile. Medium loaded with fluorescently labeled dextran (70 000 MW) is pulsed along one side of the chambers. Results of four combinations of flow pulsing sequence and flow rate are shown. (a) A pulsing sequence with equal pulse times (15 s per pulse) generates a near linear steady-state profile at the lesser flow rate (0.25 μl/min) and (b) a slightly curved steady-state profile at the greater flow rate (2.5 μl/min). Fluorescence photographs of chambers at steady-state are shown; measurement line (1100 μm) indicates where intensity is measured. (c) A pulsing sequence with unequal pulse times generates a slightly curved steady-state profile at the lesser flow rate and (d) a noticeably curved (concave) steady-state profile at the greater flow rate. Profiles for the lesser flow rate (two left side plots) correspond to 0.5 h, 1 h, 2 h, 4 h, and s.s. (bottom to top profiles, respectively). Profiles for greater flow rate and equal pulsing (upper right plot): 0.25 h, 0.5 h, 1 h, 2 h, and s.s. Profiles for greater flow rate and unequal pulsing (lower right plot): 0.25 h, 0.5 h, 1 h, and steady-state.

