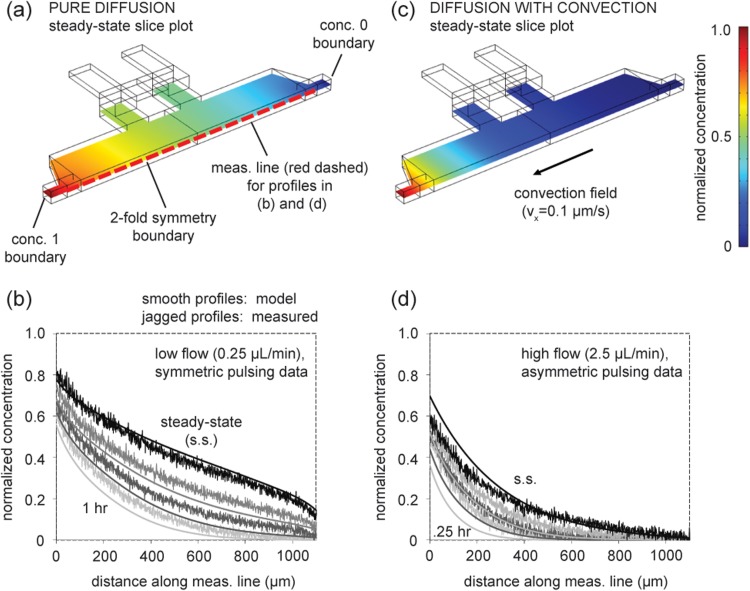
Figure 3.
Comparison of concentration profiles from numerical modeling and measured data. (a) Oblique view of 3D model geometry (half chamber) for diffusion-only simulation with concentration boundaries set at 1 and 0. Slice plot shows steady-state (s.s.) solution (at z = 25 μm, half thickness of chamber). (b) Formation of gradient from zero concentration initial condition. Transient and s.s. diffusion-only model solutions compared to measured data from low flow, symmetric pulsing experimental conditions. Profiles represent 1, 2, 4 h, and s.s. (from bottom to top), and modeled and measured profiles share corresponding grayscale shading. (c) Steady-state solution when convection is introduced. (d) Transient and s.s. diffusion-with-convection model solutions compared to measured data from high flow, asymmetric pulsing conditions. Profiles represent 0.25, 0.5, 1 h, and s.s. (from bottom to top). Simulations use diffusion coefficient of 70 kDa dextran (same MW as in experiments) as estimated in literature (∼3 × 10⁻⁷ cm2/s).44 Measurement line is 1100 μm. Note: profiles in (b) and (d) do not begin with normalized concentration 1 because measurement line does not span the entire length of the chamber.

