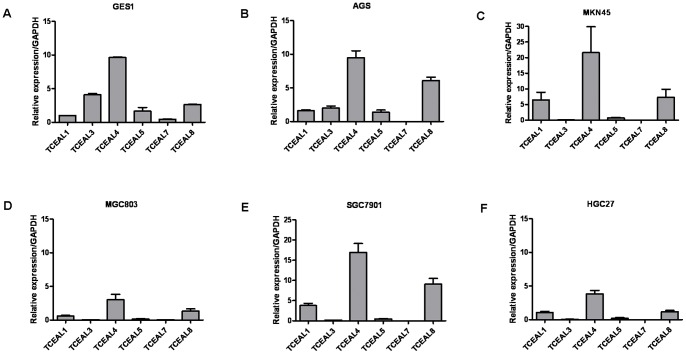
Figure 1. RT-qPCR analysis of TCEAL1, TCEAL3, TCEAL4, TCEAL5, TCEAL7 and TCEAL8 expression in normal gastricepithelial cell line and gastric cancer cell lines.
Relative expression of TCEAL7 in normal gastricepithelial cell line GES1 (A) and gastric cancer cell lines including AGS (B), MKN45 (C), MGC803 (D), SGC7901 (E) and HGC27 (F). The TCEAL7 expression level was significantly lower in the gastric cancer cell lines comparing with the levels of TCEAL1, TCEAL3, TCEAL4, TCEAL5 and TCEAL8. Furthermore, the TCEAL7 mRNA expression was down-regulated in the AGS, MKN45, MGC803, SGC7901 and HGC27 cells compared with the normal gastricepithelial cell line GES1.

