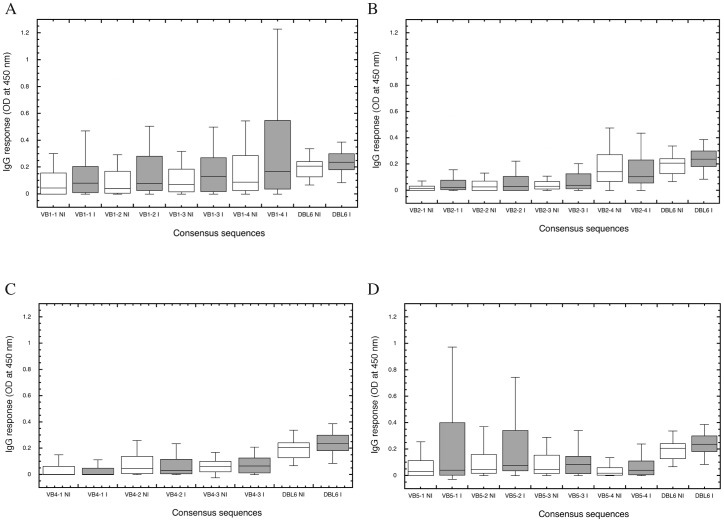
Figure 2. Intensity of the recognition of consensus sequences.
Consensus sequences determined for each VB were tested by ELISA for their recognition by purified IgGs of infected (I.) or non-infected (NI.) pregnant women. For VB1 (A), VB2 (B), VB4 (C), and VB5 (D), the top, bottom, and middle lines of the boxes correspond to the 75th percentile, 25th percentile, and 50th percentile (median), respectively. The whiskers extend from the 10th percentile and top 90th percentile. The level of response to DBL6ε–CYK48 [19] of infected and non-infected women was added on the right part of each graph to compare the VB response intensity.

