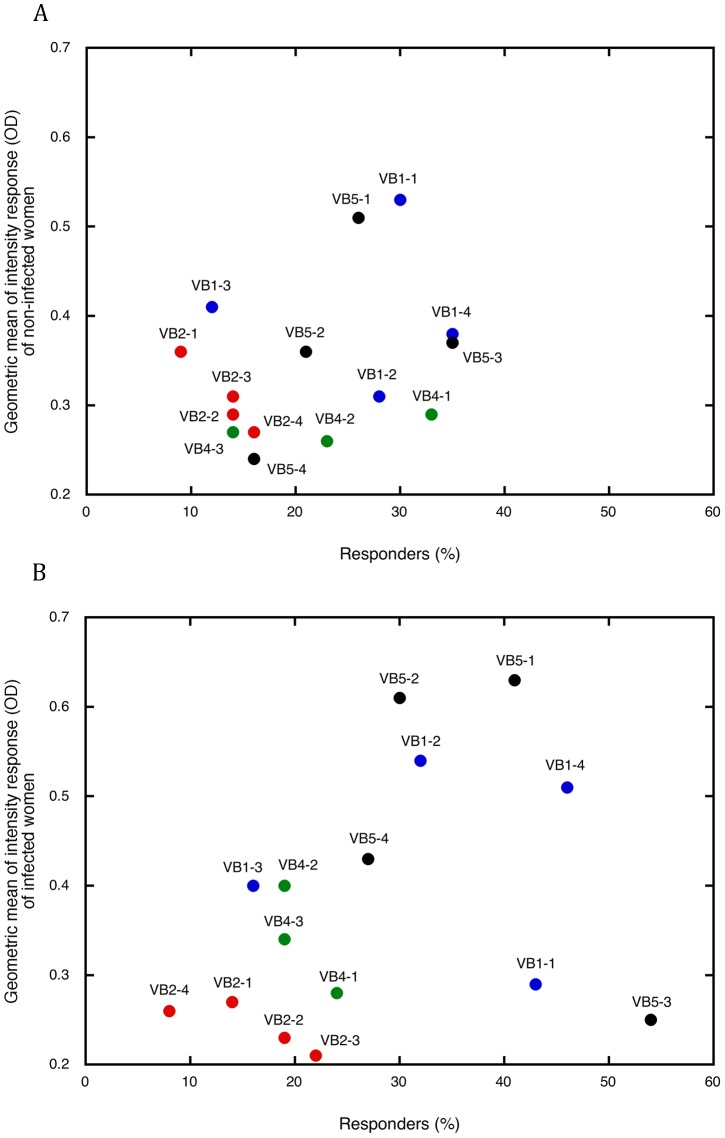
Figure 3. Characterization of the recognition of consensus sequences from 4 VB from DBL6ε by purified IgGs from the plasma of pregnant women.
ELISA reactivity of VB1 (blue), VB2 (red), VB4 (green), and VB5 (black) is plotted on a graph. Along X, the percentage of responders, and along Y, the geometric mean of the antibody response of responders within non-infected (A) or infected women during pregnancy (B). A positive response is defined as an IgG response greater than the average of the values of its group +2 standard deviations of European women response. Repartitions of dots differ in infected and non-infected women: dots of non-infected women being grouped while those of infected women are sparse.

