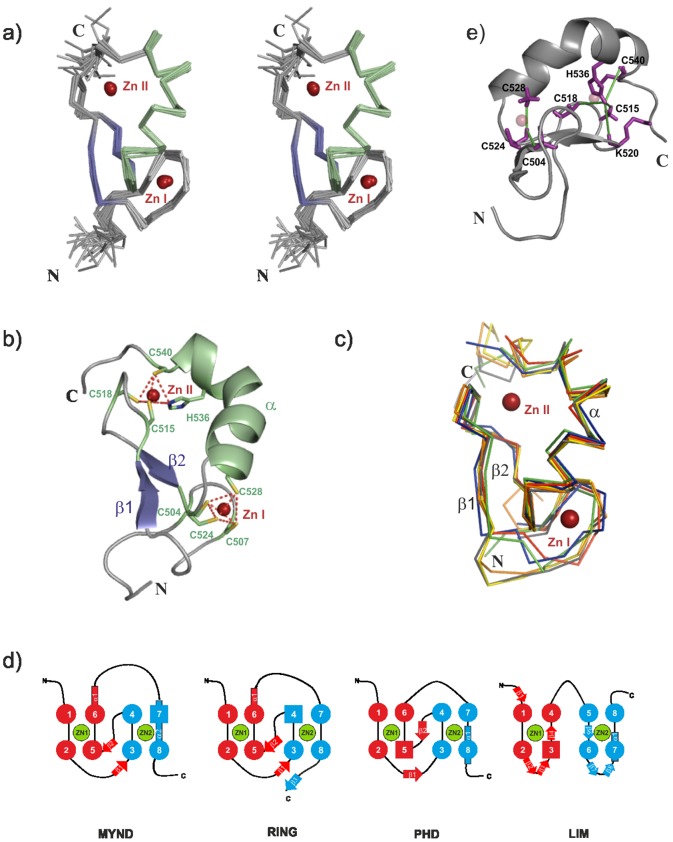
Figure 2. Three-dimensional structure of the DEAF-1 MYND domain.
(a) Stereo view of the ensemble of the twenty lowest energy structures of the DEAF-1 MYND domain. α helices and β strands are colored in green and purple respectively, whereas zinc atoms are depicted as red spheres. (b) Ribbon representation of the DEAF-1 MYND domain. Side-chains of residues coordinating the zinc atoms are shown as sticks. The zinc coordination geometry is indicated by red dotted lines. (c) Superposition of DEAF-1 (green), ETO (red), ZNF10 (Blue), SMYD1 (yellow), SMYD2 (orange) and SMYD3 (gray) MYND structures shown in ribbon representation. The two zinc ions are depicted as red spheres. (d) Schematic representation of the zinc-binding pattern and secondary structure elements in MYND, RING, PHD and LIM domains. (e) Cartoon representation of DEAF1-MYND domain. Side chains of residues for which medium and long-range NOEs are observed that unambiguously define the cross-brace zinc binding topology are shown in magenta. Green lines indicate NOEs between C524 HN/C504 Hβ*, C524 HN/C528 Hβ* for the first binding site; and H536 Hε1/C540 HN, H536 Hε1/C518 Hβ1, H536 Hε1/K520 HN, and H536 Hε1/C515 Hβ2 for the second binding site.

