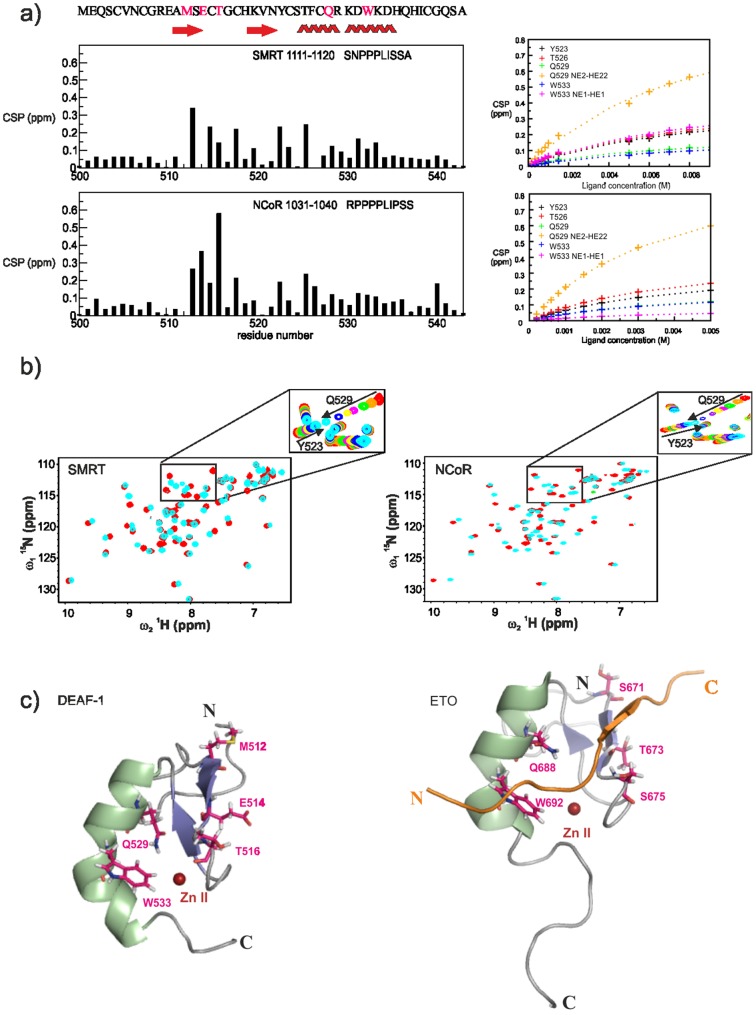
Figure 3. Binding of DEAF-1 MYND to SMRT and NCoR peptides.
(a) Chemical Shift Perturbations (CSP, see methods) observed for the interaction between DEAF-1 MYND domain and SMRT (top) and NCoR (bottom) corepressor peptides. The sequence of SMRT and NCoR peptides used for the titrations are indicated in each graph. Secondary structure elements and amino acid sequence of the DEAF-1 MYND domain are shown at the top of the panel. Residues expected to interact with the corepressors are colored magenta. CSPs of residues that are most strongly affected are shown (cross symbols) as a function of ligand concentration for both titration with SMRT (top right) and NCoR (bottom right). The observed CSPs were fitted to a binding isotherm yielding dissociation constanst of 5.30±0.54 mM and 3.08±0.12 mM for the SMRT and NCoR peptides, respectively. The binding curves are shown as dashed lines. (b) Superposition of 1H, 15N HSQC spectra of a 1 mM sample of the free DEAF-1 MYND domain (red) and upon addition of unlabeled corepressor peptides (cyan) up to a final concentration of 8 mM and 5 mM of SMRT and NCoR peptide (1∶8 and 1∶5 molar ratio), respectively. The intermediate steps of each titration are zoomed for a sub-region of the corresponding spectrum. In either case binding takes place on the fast exchange regime with respect to the chemical shift time scale. (c) Ribbon representation of DEAF-1 (left) and ETO (right) MYND domains. Residues experiencing the largest chemical shift perturbation upon addition of the corepressor peptides are shown as magenta sticks. In the ETO-SMRT complex structure the corresponding residues are shown as sticks as well, and the SMRT ligand peptide is colored orange and shown in cartoon representation.

