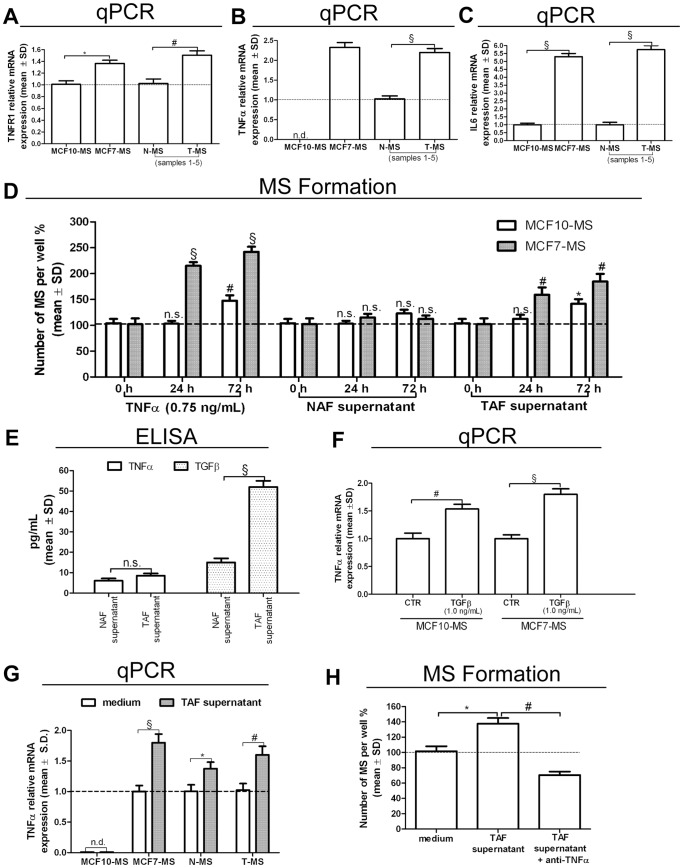
Figure 1. Autocrine TNFα loop in MS exposed to the TAF supernatant.
TNFR1 (A), TNFα (B) and IL6 (C) real-time reverse transcriptase quantitative (qPCR) mRNA analysis in MCF7-MS, MCF10-MS, T-MS and N-MS (samples 1–5). (D) MS formation assay in TNFα (0.75 ng/mL), NAF and TAF supernatant (10% final concentration)-exposed MCF10 and MCF7 for 24 to 72 h; (E) TNFα and TGFβ ELISA test on TAF and NAF supernatants (samples 6–12); (F) TNFα mRNA qPCR analysis in TGFβ (1.0 ng/mL, 24 h)-exposed MCF10-MS and MCF7-MS (G) TNFα mRNA qPCR analysis in TAF supernatant (10%, 24 h)-exposed MCF10/MCF7-MS, and in N−/T-MS (samples 5–6, n = 2); (H) TAF supernatant-induced T-MS formation assay in presence/absence of TNFα inhibitory antibody (1.5 µg/mL, 24 h, sample 13). Data are expressed as mean ± Standard Deviation (S.D.), n = 3 unless otherwise specified, *p<0.05, #p<0.01, §p<0.005, ANOVA test. n.s.: not significant.

