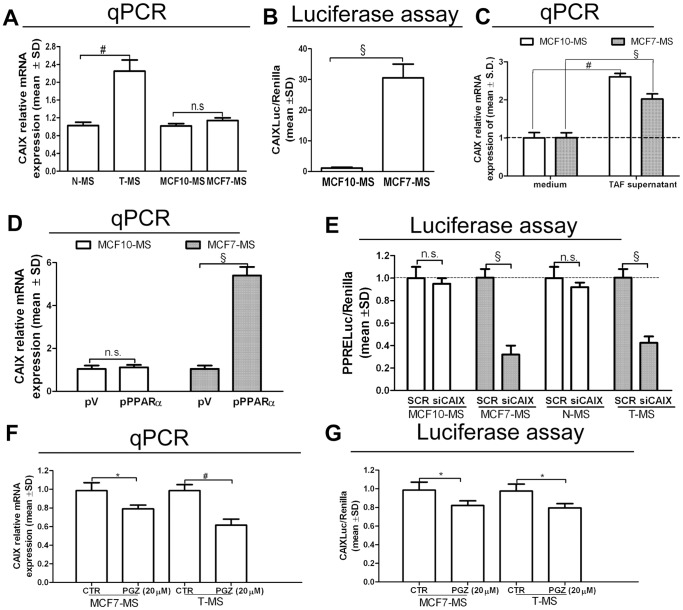
Figure 6. CAIX is under the control of the PPARα/HIF1α interplay in breast CSCs.
(A) CAIX mRNA qPCR analysis in MCF10/MCF7-MS and in N/T-MS (samples 1–5, n = 5). (B) CAIXLuc activity in MCF10-MS and MCF7-MS. (C) CAIX mRNA qPCR analysis in TAF supernatant (10%, 24 h)-exposed MCF7-MS and MCF10-MS. (D) CAIX mRNA qPCR analysis in pV/pPPARα.(24 h)-transfected MCF10-MS and MCF7-MS. (E) PPRELuc activity in SCR/siCAIX (72 h)-transfected MCF10/MCF7-MS and N/T-MS (samples 16–18). CAIX mRNA qPCR analysis (F), CAIXLuc activity assay (G) in PGZ (20 µM, 24 h)-exposed MCF7-MS and T-MS (samples 19–20): Data are expressed as mean ±S.D., n = 3 unless otherwise specified, *p<0.05, # p<0.01, § p<0.005, ANOVA test. n.s.: not significant.

